You plan to install LED lighting mainly to save money. This article will give you a few practical ways to make sure that happens!
Introduction
About 10 years ago, LED lighting really started to come in to its own.
Material prices dropped to the point that Return on Investment (ROI) was attractive for most customers.
Immediately everyone and their cousin was an LED lighting expert. Manufacturers and installers sprang up everywhere (kind of like solar more recently!).
As more and more projects were implemented, we unfortunately heard many stories of customers who were disappointed in how much they actually saved.
The fixtures were the right wattage, which was confirmed with a meter, but the dollar savings on the bill wasn’t as high as the vendor had told them.
What went wrong?
Here’s two common mistakes that can happen with LED lighting savings calculations that could impact your actual dollar savings.
Issue #1 – Overstated Runtime
A kilowatt-hour is POWER over TIME. One kilowatt of lighting left on for one hour = 1 kWh.
Here’s a graphic to show this relationship.
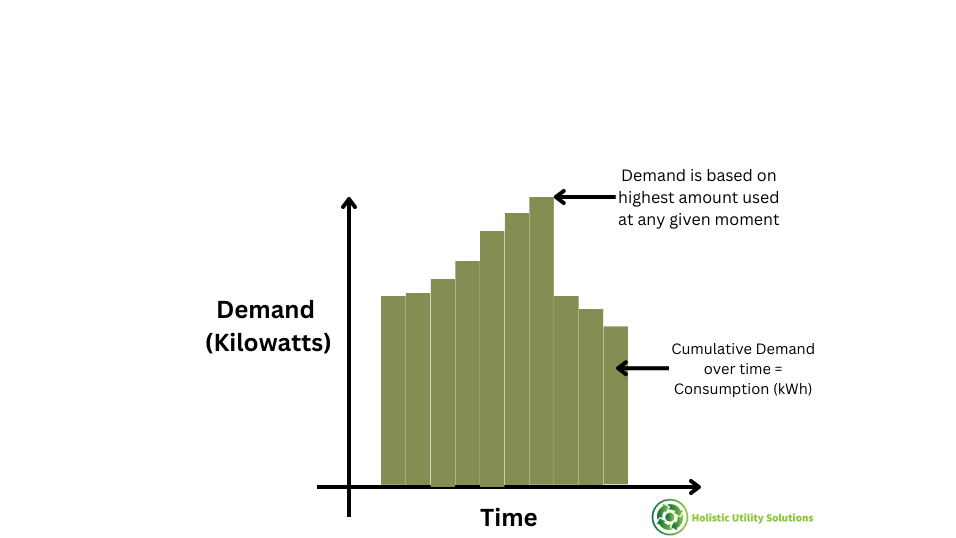
(For you calculus nerds, consumption is the integral of the demand curve)
If you pay $0.05/kWh, this cost you $0.05.
If you assume that 1KW of lighting runs 3,200 hours/yr, the kWh cost would be $160.
If that same 1KW only runs 2,500 hours/yr, the cost would only be $125.
For this reason, runtime is a critical input to a savings calculation.
Why “Guaranteed” LED Savings Doesn’t Always Add Up
The International Performance Measurement & Verification Protocol (IPMVP) lays out 4 main “Options” for measuring and verifying energy savings.
The most common M&V option for lighting is Option A – Partially Measured Retrofit Isolation.
This is how it’s usually done:
The installer puts a meter on the existing lighting and the new lighting to confirm the wattage reduction is what was expected. If that’s good, they say savings is met!
This does help verify one important aspect of the calculation (KW Reduction), but if the before and/or after runtime is off the total savings would still be wrong.
During Energy Savings Performance Contracts or Energy-as-a-Service contracts with “Guaranteed Savings”, this can become. a point of contention as the Energy Services Company (ESCO) will point to the Option A measurements and claim the project is performing as stated, while the customer is left holding the bag if the runtime assumption was wrong. (usually this assumption is listed somewhere in the paperwork as an agreed upon value)
So what do we do?
We aren’t suggesting that using Option A M&V for lighting is wrong. The other options have their challenges too. Option C (Whole Building) is really only best if you have at least 7-10% savings, as smaller amounts can get lost in the “noise” and margin of error. Lighting alone isn’t usually a great fit…
Rather, in Option A M&V you must understand all the assumptions that go in to the calculation, how each one was determined, and which are being verified.
Key Point
In Option A M&V you must understand all the assumptions that go in to the calculation, how each one was determined, and which are being verified.
Improving Runtime Assumption Accuracy
As we’ve discussed, the two biggest contributors to an accurate kWh savings calculation is RUNTIME and KW REDUCTION.
Here’s how to improve the accuracy of the runtime assumption:
Separate Areas, Separate Assumptions
Rather than treat all areas in the building as a single “average runtime”, separate by space type. For example, a school would have classrooms, cafeteria, gymnasium, etc.
Each space would then apply its appropriate runtime for the fixtures in that area.
This will create an overall “weighted average” runtime that is much more accurate than assuming all spaces at an average time without counting up each respective component.
Third Party Standard
Rather than pick a number out of the air, use a 3rd party standard from a well accepted authority. You may have something from your state level school or energy associations, or you can reference national standards from a group like the Illuminating Engineering Society (IES).
Actual Data
The gold standard is actual data from your site.
If you have your lighting on a centrally controlled system, you may be able to reference the actual schedules and use that data.
Most sites won’t have this capability, so the other option is to use data loggers. HOBO makes loggers that will capture both light on/off in a space as well as occupancy.
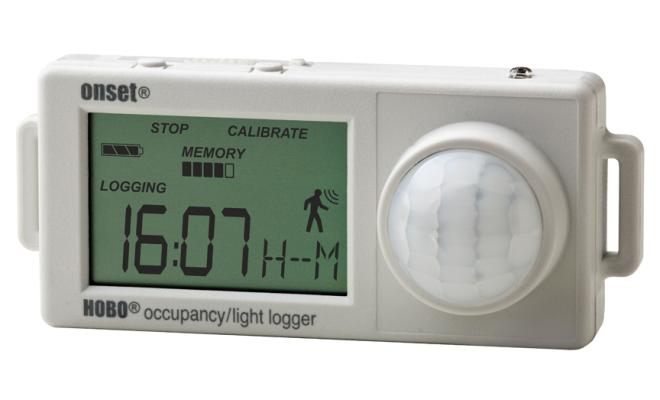
These will not only help you confirm how much the lights are currently running, but if you are considering adding occupancy sensors they will tell you how much runtime would be reduced with the improved controls.
Note that when using data loggers, there is still a level of uncertainty in the data. Depending on how much you log and for how long, you can determine this statistical variance and apply to the savings calculations accordingly. Ultimately all savings calculations are really estimates with some margin of error and should be considered a range, not a discreet value.
The last option is to use smart meter data from your electric meter. This is hard to do for a typical office building or school, as the lighting load will be blended in to overall loads and hard to see in usage data.
However, for a meter where lighting is a big part of the load and turns on and off all at once, you can clearly see these trends in the data. For example, an unconditioned warehouse or parking lot with a lot of Metal Halide fixtures will likely have a distinct pattern.
Issue #2 – Improper Electric Rate Application
It is common to use “blended electric rate” for LED lighting savings calculations. This is:
Total Electric Cost/Total kWh Consumption
This may be close, but the more accurate way to calculate is applying the DEMAND rate to KW reduction and the kWh rate to CONSUMPTION.
Add the two together and you have it right.
We recently looked at a lighting retrofit for a facility that had a blended rate of $0.118/kWh. When we used the blended rate for the savings calculation the annual savings was around $6,200.
Here’s the math:
KW Savings
| Existing KW | New KW | KW Savings |
| 22.65 | 10 | 12.65 |
kWh Savings
| Existing Runtime (hrs/yr) | Existing kWh | New Runtime | New kWh | kWh Savings |
| 3,500 | 79,275 | 2,661 | 26,610 | 52,665 |
You’ll notice that the runtime decreased. This is because we were replacing high bay fixtures in a warehouse that had no controls with new fixtures that will have an occupancy sensors.
The controls increase kWh savings, but not KW savings.
If we take the kWh savings and multiply by the blended rate ($0.118/kWh), we get to $6,214/yr. Note there’s no additional HVAC savings because this is an unconditioned warehouse.
When we calculated the demand and consumption separately, savings was only $4,200.
Here’s the math.
KW Savings
| KW Savings | kW rate (per month) | KW Savings/yr |
| 12.65 | $10.25/KW/Mo | $1,556 |
kWh Savings
| kWh Savings | kWh Rate | kWh Savings/yr |
| 52,665 | $0.05/kWh | $2,633 |
Total Savings
| KW Savings | $1,556 |
| kWh Savings | $2,633 |
| TOTAL SAVINGS | $4,189 |
If we had used blended rate here, we would have overstated savings by 48%
Why is this so different from blended rate?
The issue is Load Factor.
Load factor is the ratio of consumption to demand. A Load Factor of 100% means a light is running 24/7. As that drops off, the load factor decreases accordingly. Here’s a graphic.
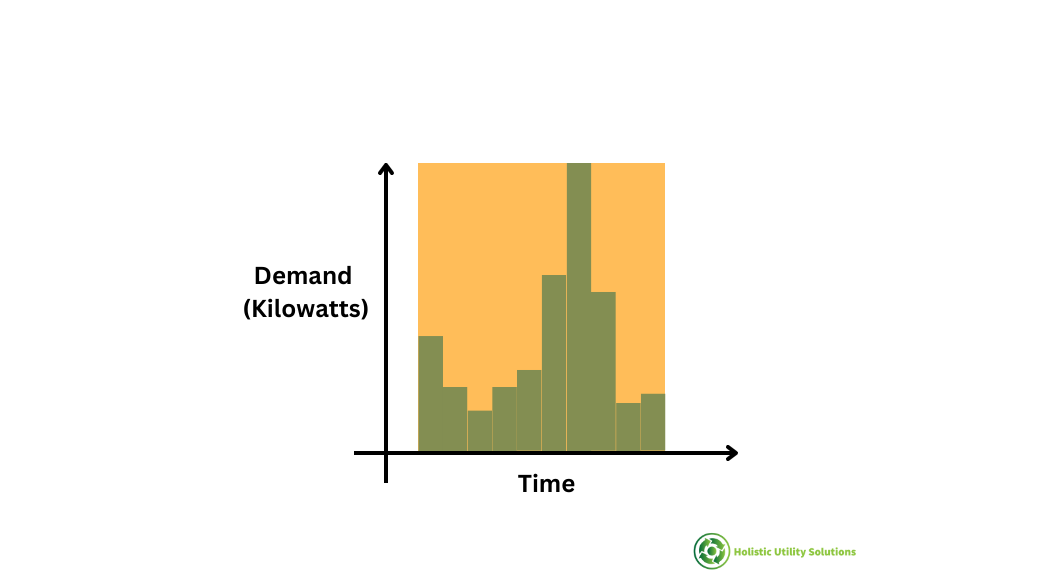
The meter/building overall will have a load factor that influences rate. This is a combination of all the various loads, when they run together, and how they each run over time.
If the load factor of the lights aren’t the same as the load factor for the overall meter, the blended rate approach will not be accurate. Since we changed load factor by introducing controls, this further complicates the equation.
Key Point
If the load factor of the lights aren’t the same as the load factor for the overall meter, the blended rate approach will not be accurate.
Rather than try to calculate each load factor separately and then use blended rate, it is better to just calculate the Demand and Consumption savings separately.
Conclusion
LED Lighting retrofits aren’t rocket science, but good design and good calculations are key to a successful project.
When priced properly, most systems will have an ROI that is attractive to facility owners and managers.
By applying accurate calculations, the credibility of all involved and long term customer satisfaction will be preserved.
Happy customers, repeat business, and real savings. What’s not to love?
We work as owner’s rep for customers considering LED lighting projects and also complete turnkey installs in Texas. Reach out if you have questions or would like to discuss a project.
Related Reading from Holistic Utility Solutions:
The Impact of COVID on Commercial Building Energy Usage
How to Implement a Cost-Effective Energy & Sustainability Strategy
8 Ways an Owner’s Rep Benefits Your Energy & Sustainability Project
5 Reasons Not to Complete an Energy Savings Project