Texas has a complicated electricity market and very little net-metering. This makes proper design and sizing of commercial solar systems critical to achieving expected savings.
If you are considering a solar system on your commercial facility, this article will help you ask the right questions and avoid potentially making a multi-million-dollar error.
Review of Consumption vs. Demand
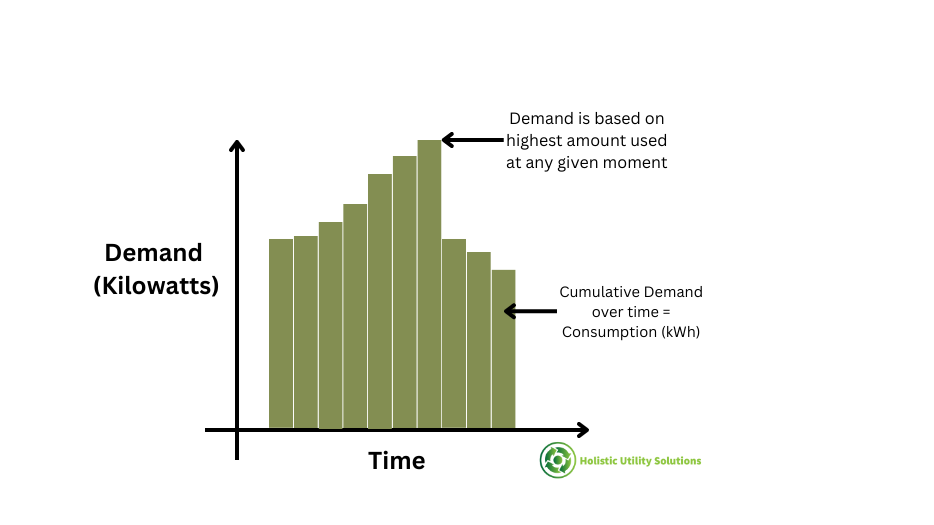
During this article we’ll often refer to consumption and demand, so let’s do a quick review on each. Demand is measured in Kilo-watts (KW) and shows how much electricity is being used at any given moment.
1KW of electricity used for 1-hour = 1kWh. This is consumption.
Understanding the difference between these two is important, as each is measured and billed differently in most large facilities.
Consumption (kWh) Basics
Consumption, also sometimes referred to as “commodity”, can be procured from a number of Retail Electric Providers (REP) in most parts of Texas. This is because Texas is mostly a deregulated market. The exception are areas covered by municipal providers, cooperatives, etc.
Rates vary based on load profile, length of term, market conditions, contract structure, and more. We provide services to help you navigate all of this is needed.
Demand (kW) Basics
Demand charges come from the Transmission and Distribution Utility (TDU), not the REP. In North Texas this is mostly Oncor. These are listed on the bill as TDU or TDSP (Transmission/Distribution Service Provider).
We often see about half the energy bill cost coming from Consumption/REP and half coming from Demand/TDU. This ratio will vary based on the utility, REP, and load profile.
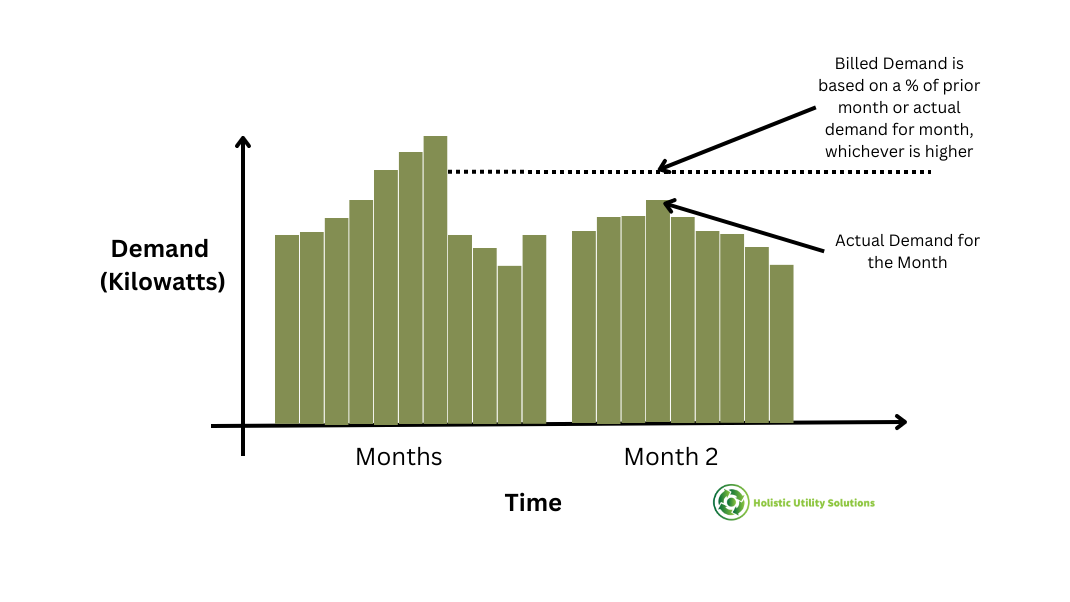
When a TDU/TDSP bills for demand, they usually base it off of the highest usage in any one 15-minute period throughout the month. What’s more, many utilities have a “ratchet”. A ratchet is where the Billed Demand for any given month may be based on a percent of the highest demand in the past. In Oncor, this amount is 80% of the highest 15-min demand in the past 11 months.
For example, if a load hit’s a peak demand of 1,000KW in July, it will always pay for monthly Billed Demand of at least 800KW for the next 11 months, even if Actual Demand is lower than 800KW. If Actual Demand is between 800KW and 1000KW, Actual and Billed Demand are the same. If Actual Demand is over 1000KW, that month’s Actual and Billed Demand are the same and a new ratchet is set for the next 11 months.
Coincident Peak (CP) vs. Non-Coincident Peak (NCP) Demand
The further complicate the demand question, many utilities charge different rates for Coincident Peak vs. Non-Coincident Peak Demand.
Coincident Peak looks at when demand is highest for the overall grid and then what the demand is for the facility at that same “coincident” time. In Texas, there are 4 Coincident Peak times (4CP). These are the highest 15-min of grid demand during the months of June-September.
The 4CP times are generally going to be the hottest weekday afternoons of each of respective month. The facility demand for each of these periods is averaged and used for the Coincident Peak demand portion each month of the following calendar year.
The good news for solar is the 4CP times are usually times when the solar panels are also going to be producing a lot of power. More on this later…
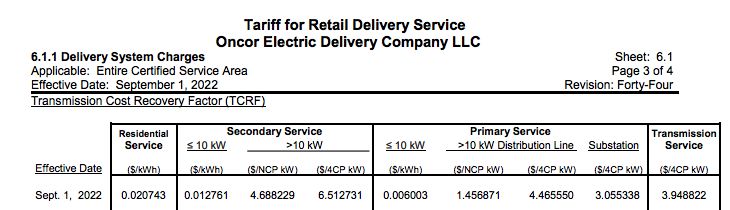
Coincident Peak and Non-Coincident Peak demand charges in the Oncor region can be seen on Page 95 of this Tariff Sheet. We’ll use $4.68 NCP and $6.50 CP for purposes of this article.
Consumption Impact of Load Sizing
Most of Texas does not have net metering (some utilities allow it on systems of a certain size). This means excess generation above what is “self-consumed” by the facility at any given time is not credited against power purchased from the grid at other times.
Rather than net metering, excess power exported to the grid is usually credited at the utility’s cost of power at that given point. At times this may be advantageous to the solar system owner, but generally this credited rate is lower than their contracted commodity rate.
For example, if a facility is paying $0.05/kwh for their commodity, they may only get $0.02-0.03/kWh credit for any excess power generated.
It’s important to realize this self-consumption is not measured on a monthly basis, but an instantaneous basis.
Example 1
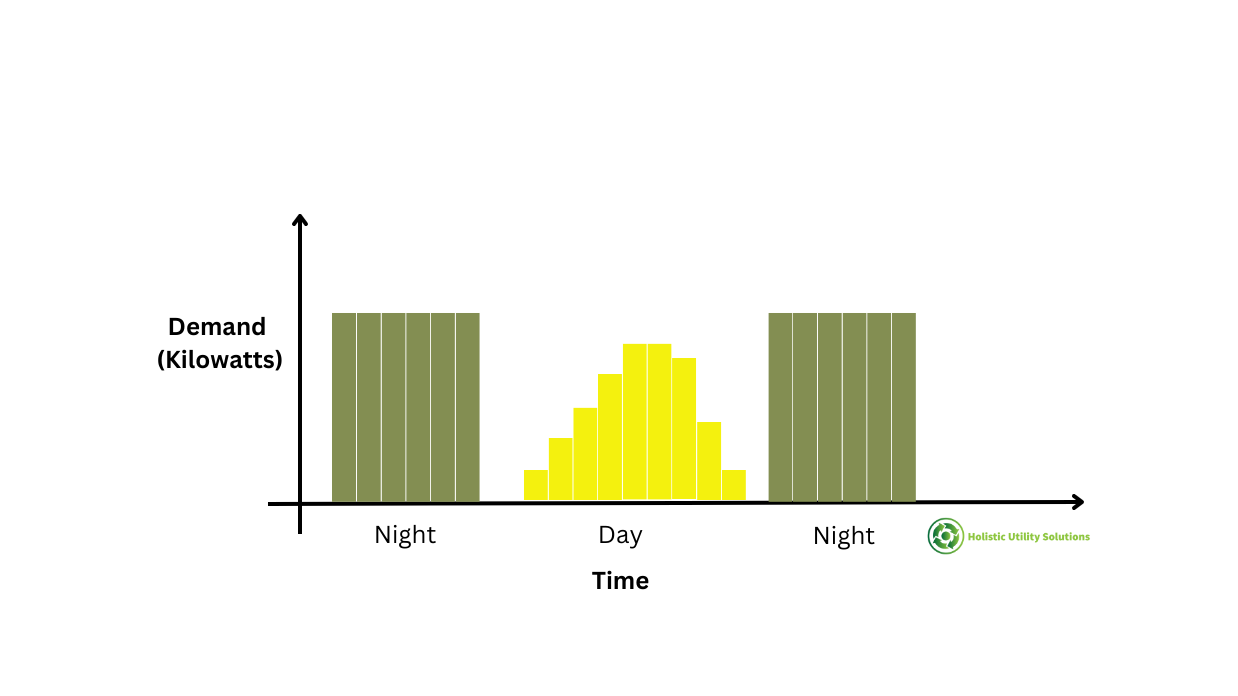
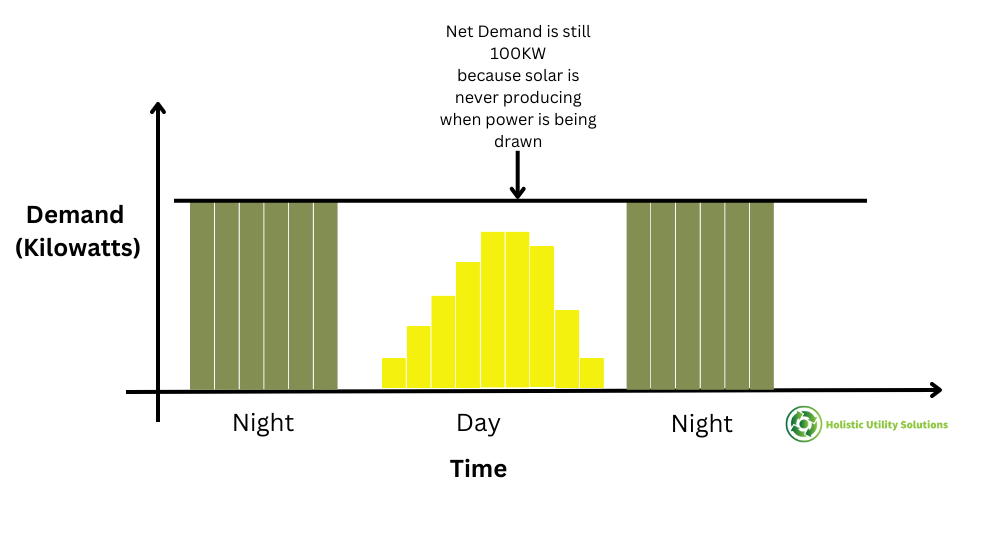
Imagine a meter that only draws load at night. Perhaps it feeds exterior parking lot lighting. From 10pm-4am it uses an average of 100KW, or 600kWh each night (18,000 kWh per month, 219,000 kWh per year).
Interested in savings on electricity cost, the meter owner decides to investigate adding solar. They head over to PV Watts and plug in a 125KW-dc system and see that it will produce about 188,000 kWh per year. This is 86% of their current load, so it seems to be appropriate….or is it?
The issue here is that the power is only produced during the day, which all the power is produced at night.
Since the utility is watching for excess consumption at any given moment and not just across a day/week/month/year, any solar power produced will only be given the value of its real time or wholesale pricing value, which may be less than the cost of power for their actual load.
Assuming the avoided cost of power averages $0.02, the commodity savings portion of this bill will be about $3,750 per year.
Example 2
Now contrast this scenario with the same 100KW load that is only used between 10am and 4pm. Perhaps it’s a set of pumps that run on a set schedule each day.
In this scenario, we can see that at any given time the power produced by the solar system will be used by the motors.
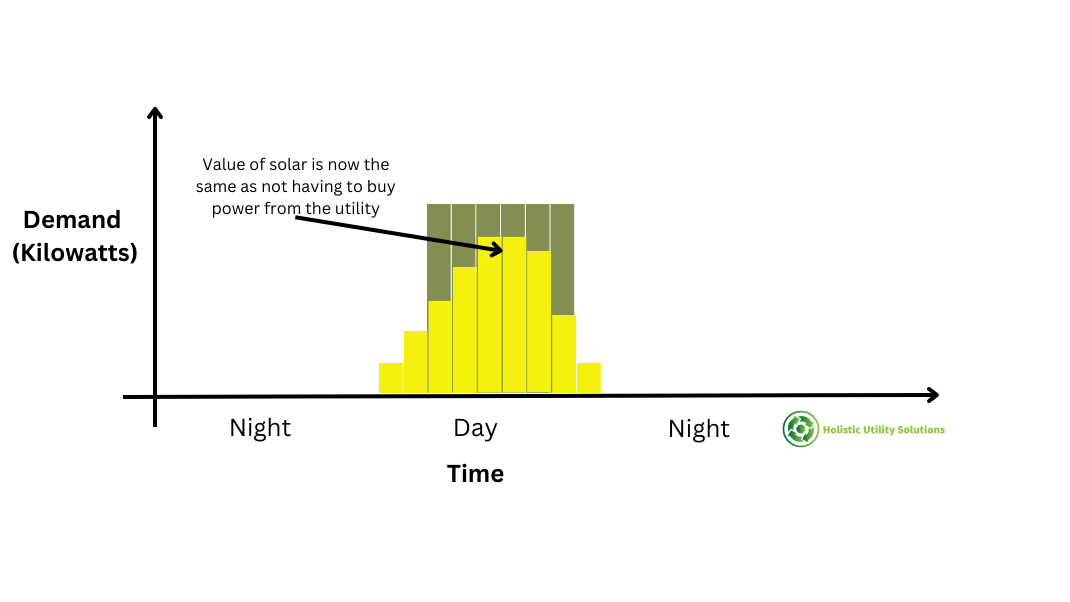
Since there is much less of a net export to the grid, the value of the solar power produced is the mostly as the cost of power ($0.05/kWh), as this power never needs to be purchased at those rates. This means the commodity savings portion of the system will be $XXX.
Demand Impact of Load Sizing
Given that demand is based on a single 15-min period in the month or year, we must also understand how solar will offset demand with a high level of confidence.
Let’s go back to our Examples. in Example 1 with the nighttime load, Demand will not be impacted at all because the solar does not produce power when the load is being used.
Since this load has no Coincident Peak demand, they would only be paying for NCP rates ($4.68) for the 100KW load. However, this will not be lowered at all due to solar, so the only savings will come from the value of consumption exported to the grid.
In Example 2, Demand will be reduced significantly as the TDU will only see the net power between the solar production and the electric load.
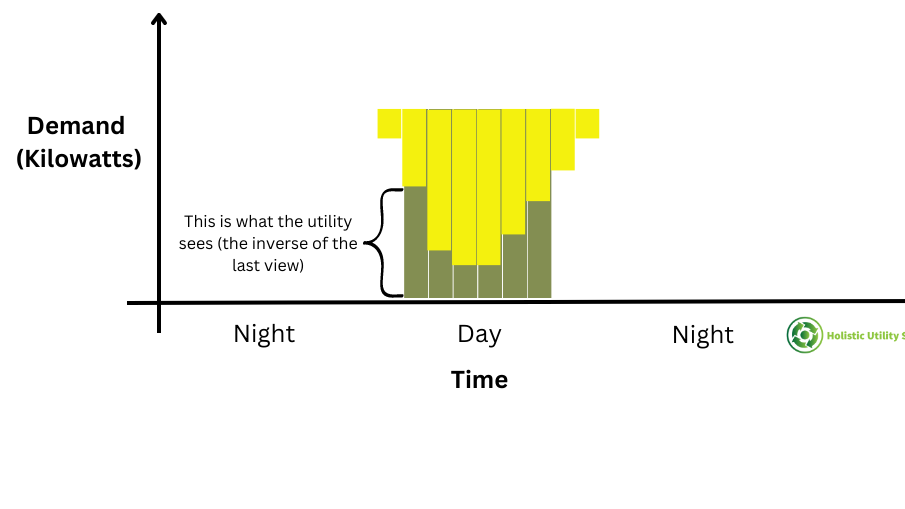
Since this load is active during Coincident Peak times, the savings will be on both 4CP and NCP rates.
The risk with calculating demand savings is that load profiles are not static. Suppose we have Example 2 with daytime loads. If a technician comes in at night and fires up the motors for some annual testing for 15-minutes just one time, they reset the demand for the year and erase most savings the solar should have produced for Non-Coincident Peak Billed Demand.
If the TDU has a ratchet, this one-time demand will carry forward every month.
The good news is that Coincident Peak Demand is more predictable for solar. We know it is going to happen on a hot, typically sunny, Summer afternoon in Texas. Unless the solar system is not functioning during this time, we can count on good production.
What’s more, the NCP charge is based on the average of the 4 months. This means even if the solar system isn’t producing as much as expected during one NCP period, that reduction will be averaged in with the other three dates.
Putting It All Together
We’ve said all this to lay the groundwork on this point.
It is critical that we size solar systems appropriately for each meter’s rate structure and load profile.
We often see solar proposals given to customers simply based on offsetting some portion of monthly or annual consumption. This works in net metering states, but is not at all appropriate for most facilities in Texas.
Thankfully, most of Texas has smart meters. This allows us to download the 15-minute Interval Data and model it with the solar system output to analyze this properly.
Once we analyze the load, solar production, and difference between them on each 15-minute period throughout the year, we can size the system appropriately for the given TDU and REP rate structure.
In most Texas installations, we will not want to design a system that produces more than the building will consume at any given time. However, this isn’t always the case if the Retail Electric Provider has a special rate plan for solar or the municipal/cooperative has a more favorable structure than the bigger deregulated markets.
On Demand savings, we recommend assigning a significant safety factor to Non-Coincident Peak savings due to the risk of a single 15-min “mistake” removing most of the savings for an entire year. This safety factor may be as high as 80% reduction on NCP savings.
For Coincident Peak savings, we can be more aggressive. Perhaps we use a 20-30% safety factor.
A Note on Energy Storage & Commodity Rate Contracts
All of the above assumes we do not have a storage system coupled with the solar panels. However, you can likely see how a battery storage system could help increase savings by better managing when power is produced vs. consumed. We can now have more control over demand reduction, so there’s concern about inadvertently setting a peak demand that erases savings.
We won’t go into depth about the calculations required to size a battery storage system, considerations of adding backup generation, or other load shifting techniques. These should be considered though and may make financial sense for certain situations.
Regarding commodity contracts with Retail Electric Providers, since solar may drastically shift the load profile of a site we may need to consider the impact on existing REP contracts. Some contracts may penalize a big change in consumption. Other times it may make sense to shift to a different rate structure that is more conducive to the new load profile with solar and/or storage.
Conclusion
Solar and/or energy storage can make a lot of financial sense for large facilities like schools, office buildings, etc. in Texas. However, due to the complexity of our rate structures each situation must be appropriately analyzed in order to provide a realistic savings projection.
If you’re a facility owner and have made it this far in the article, you are now well equipped to ask the right questions on your potential project and ensure the analysis is being done properly.
If you’d like us to also look at your project, please reach out. We offer both consulting/owners rep services as well as turnkey projects and would welcome an opportunity to support you.
Be Blessed,
Ira