Introduction
A common driver for water utilities to update their metering system is the improved accuracy of new meters….but do new water meters actually increase water revenye?
Quantifying the impact of the increase in accuracy is important to understanding the financial impact to the Water/Sewer Fund, ROI of the project, as well as change to customer bills.
In this resource article we’ll discuss some of the considerations in measuring current meter accuracy, the impact to water loss, potential offsetting factors, and the net impact to water consumption.
Meter Life
As mechanical meters age, they tend to “slow down”. This translates to an expected reduction in accuracy over the life of the meter.
The rate of this degradation in accuracy is dependent on the type of meter, quality of water, and amount of total flow. For these reasons it is hard to just say that a mechanical meter has a life of 10 or 15 years, as it is a function of multiple variables.
An analogy can be made to a car. When you consider the value and remaining useful life of a used car you have to consider not only how old it is, but how many miles it was driven. The conditions it was driven in also impact life, as a car in a pothole filled, salt laden, Northeastern city is going to be in much worse shape after 100,000 miles than a garage kept, highway cruiser from Phoenix.
While rules of thumb (1M gallons flow, 10 or 15-year life, etc.) can be used for replacement planning, when evaluating the contribution of meter inaccuracy to a system’s total water loss there is no substitute for actual test data on a statistically relevant sample of the entire meter population.
Meter Testing
Testing of a large volume of meters is typically subcontracted to a specialized company with a mobile testing unit. For smaller meters (2” or less) the meter is removed, a dummy put in place, the meter is tested, and then the unit is replaced. This minimized disruption to the customer and keeps logistics simple. Larger meters of 3” or above are typically tested in place by isolating the flow through a backflow preventer or test port.
In either case, the meter being tested is checked against a calibrated meter to confirm accuracy. Flow is normally checked at the AWWA standards of Low, Medium, and High for each respective meter size. Ultra-Low Flow tests can also be conducted if the replacement meters are expected to have much higher accuracy at these ultra-low ranges and these losses are also expected to be captured.
Sampling Meters for Testing
When conducting meter testing, it is standard to test or survey a sample from the overall number of accounts. This is done to reduce cost and coordination vs. testing every meter. However, whenever a sample of a greater population is selected a level of uncertainty is introduced.
Key Point
The key to a strong statistical analysis is striking the balance between cost of analysis and accuracy of the results. This level of accuracy is measured in “Confidence” and “Precision”.
Whenever we collect and represent data we should state the finding in terms of their uncertainty. For example, if we select our sample size to gain a 90% Confidence Interval (CI) with 10% Precision, it means we’re saying “We are 90% confident that these results are accurate within +/-10%”. The higher we go on this CI and Precision the greater our sample size needs to be.
Before selecting a sample you’ll also want to separate the population by common characteristics. For example, you may break down the total number of accounts into groups by meter size or small meters vs. large meters. Whichever is selected, the resulting data must only be applied back to the population.
Given population (total number of accounts), Confidence Interval, and Margin of Error (Precision), sample size can easily be determined with an online calculator.
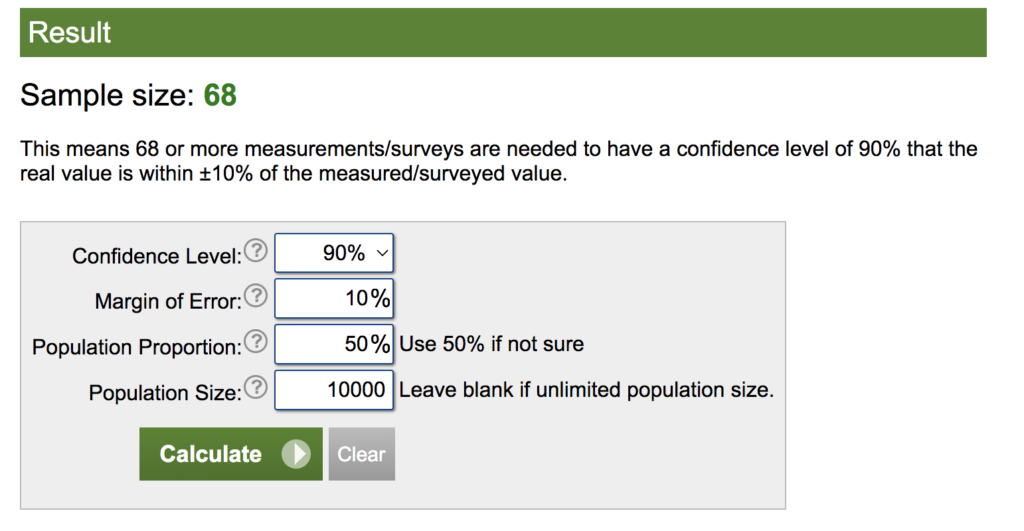
Based on 90% CI and 10% Precision for a population of 10,000 single family residential meters, here’s the required sample size:
If we desire to reduce the margin of error (increase precision) from 10% to 5% we can re-run the model.
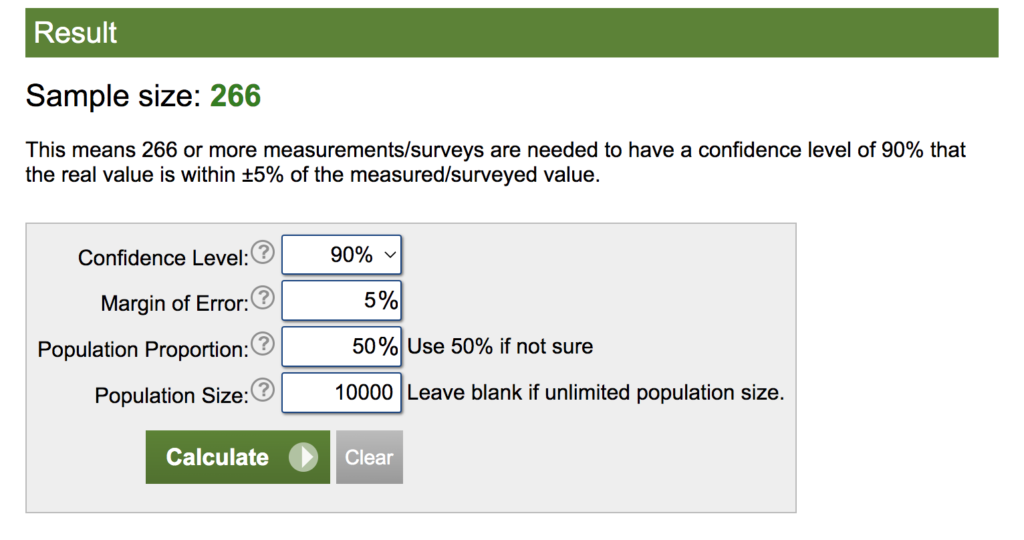
This increased precision would require 200 more meters to be tested. Depending on the goals of the utility and available budget the appropriate level of Confidence & Precision should be selected. Note there is no right or wrong level, but whatever level is selected should be clearly stated and considered for all relevant calculations.
We generally recommend that Confidence (80%, 90%, 95%) is kept consistent for all population/sample sets. Margin of error can then be adjusted based on the impact of a given population/data set on the overall value.
For example, if 5/8” x ¾” meters represent 60% of the overall billed gallons in a system a higher level of precision would be warranted than 1 ½” meters if they only represent 10% of the overall flow. When summed together the low and high ranges of each population group can be accounted for to create a total range.
Clarifying Statistics Comment
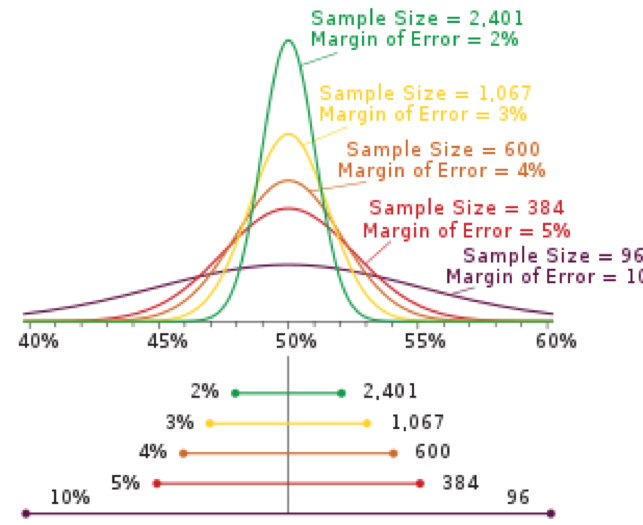
Since we’re talking about precision in percent and also measuring meter accuracy we have to be careful not to confuse the two. We aren’t saying that a set of meters that tests at an average of 90% accuracy are actually between 85% and 95% if they are at a 5% precision. Rather, it is a function of the standard deviation of the sample, as illustrated in the bell curves shown below.
Applying Test Data
Assuming there are no other changes in usage patterns resulting from the implementation of new meters and/or AMI system then the resulting decrease in non-revenue water would be a simple function of the increase in accuracy from existing meters to new meters multiplied by the flow of those meters in that group.
This is a good place to start in our calculations.
Take your matching sample/population average accuracy for each level of flow (Low, Medium, High) and apply to the typical usage pattern seen for that meter size. This is an assumption, but usually about 5% goes through Ultra-low flow, 15% through low flow, 70% is going through Medium flow, about 10% through high flow.
These values create a weighted average accuracy by sampled group.
This weighted average must then be applied to the total amount of flow going through that meter size. Going back to our example of 5/8” x ¾” meters that represent 60% of the water flow, the weighted average current meter accuracy would be applied to this amount of flow. The new meter can be assumed to be accurate based on the manufacturer’s data/warranty.
Note that while the above calculations will result in a single number, that number is simple the average with a level of uncertainty that is based on the chosen sample size. If 90/10 CI and Precision was chosen this value should be stated as “We’re 90% confident the decrease in non-revenue water will be +/-10% of this value”.
Confounding Variables
While the above logic is sound assuming no other changes, we should also consider some confounding variables introduced when we change out the meters and/or AMI technology.
Elasticity of Demand
Shifting from statistics to economics, we have a variable introduced due to how increased cost will impact user’s water consumption habits.
Elasticity of Demand is a measure of how much usage patterns will vary when price changes. While we may not be changing the water rate, if the average user sees a 3% increase in their bill because of the difference in old vs. new meter accuracy they may decrease their consumption to save on costs.
This elasticity of demand is difficult to quantify, especially in advance. By definition it is a curve that typically varies with the severity of the change and the economic threshold of the population. A 3% change in an affluent community may not even be noticed and have no relevant impact on usage patterns. However, a 10% increase in accuracy in a lower socio-economic community may cause a substantial behavioral change in efforts to minimize water consumption bills.
Conservation Technology and Programs
If a meter changeout is coupled with new Advanced Metering Infrastructure (AMI) technology we may also see decreases in consumption. Here’s a few examples.
If the new system has consumer leak alerts that are very accurate at low flow, more small leaks will be caught earlier. This is good for conservation, but has an offsetting impact to total water sales.
Similarly, visibility to data may change behaviors. While not every user will care about user dashboards showing their data, some may change major habits such as irrigation frequency and duration once they can easily see exactly how much water is used in these activities.
The City may also use the new AMI data as part of water conservation programs, such as watering days or courtesy alerts for leaks.
We encourage water conservation and it is a major benefit of AMI projects, but when calculating impact to total water/sewer revenue and not just water loss rate we must consider how these offset water sales.
Tying it All Together
Unfortunately, no known studies have been completed to measure how all of the above interact. The percent of water loss before and after a project is one indicator, but since water loss due to meter inaccuracy is typically just 5-20% of the total water loss (stated differently, if total water loss is 15%, the amount attributed to meter inaccuracy may only be 0.75%-3%) it is difficult to see such a relatively small change against the standard Year over Year variation in water loss.
This type of top down measurement & verification would be considered Option C by the International Performance Measurement and Verification Protocol (IPMVP). IPMVP usually doesn’t recommend Option C unless the total change will be at least 10% as anything smaller is typically caught up in “noise”. Note this 10% threshold is % of water loss, not % of total water use, so it may apply in projects where a large amount of water loss reduction is attributed to meter inaccuracy.
In addition to variation in water loss, total water consumption varies substantially year over year, especially in areas that use a lot of irrigation (causing rainfall dependent usage). This makes quantification of non-revenue water based on total consumption nearly impossible as well.
Even if these items could be isolated, measured, and normalized we would still have differences due to the demographic makeup of different communities and their respective water users, making it difficult to apply guidelines between cities.
Due to the complexity above, some cities have decided to assume no increase in water/sewer revenue associated with a project. This may be too conservative as the net impact will likely still be positive. If this approach is taken and all project costs are funded through water rate increases then the customer may be hit with a “double whammy” from increased rates and increased accuracy.
Summary
Perhaps the best we can do for now is to accurately quantify the theoretical impact due to old vs. new meter accuracy and then apply safety factors based on knowledge of the community and discussions amongst staff.
If you’re considering an AMI rollout and would like to talk more about these considerations please reach out via our Contact page. We’re always available to chat.
The Holisus Team
Bonus: A Note on “Savings Guarantees”
A common way to fund AMI upgrades is through Energy Savings Performance Contracts. These contracts use the expected increase in water/sewer revenue to fund the cost of needed upgrades. The water/sewer revenue is typically stated as a “guaranteed” increase.
While it is not always the fault of the Energy Services Company (ESCO) completing the project, the term “guaranteed savings” is a bit confusing due to all the factors we’ve discussed so far. The ESCO simply cannot actually guarantee that the revenues will increase by a certain dollar amount.
Rather, the ESCO completes the analysis we’ve described on existing vs. new meters and then layers in a guarantee that the new meters will meet a certain minimum level of accuracy. This is measured by testing a set of the new meters at some point(s) after they’ve been installed. Assuming no other offsetting factors or inaccuracy introduced in the sampling methodology, this would translate to actual revenue increase.
Energy Savings Performance Contracts can be a very good way to fund and implement programs like AMI conversions, energy efficiency work, etc. Just be sure to discuss the considerations we’ve talked about in this resource article to make sure you’re comfortable with the assumptions being put into the revenue analysis being completed by the ESCO as you’re still taking the risk associated with the uncertainty of these calculations.
Be Blessed,
Ira